The Stock Market’s Hidden Code
1. Earnings Per Share (EPS): The Key to Understanding Profitability
Before diving into market ratios, it is crucial to understand Earnings Per Share (EPS)—one of the most important metrics in stock analysis.
What is EPS?
EPS = Net Profit ÷ Total Number of Shares Outstanding
Why is EPS Important?
• A higher EPS indicates a company is generating more profit per share, making it attractive to investors.
• EPS is used in calculating the P/E Ratio, helping investors determine if a stock is overvalued or undervalued.
• Companies with consistent EPS growth are considered financially stable and strong investment options.
Types of EPS:
1️⃣ Basic EPS – Net income divided by the total number of shares.
2️⃣ Diluted EPS – Considers stock options, convertible bonds, and other potential shares that could be issued.
If a company earns $10 million in net profit and has 2 million outstanding shares, the EPS would be:
EPS = $10,000,000 ÷ 2,000,000 = $5 per share
This means that for every share owned, the company earns $5 in profit.
By understanding EPS, you can make better stock investment decisions and evaluate whether a company is truly growing or just overhyped.
2. P/E Ratio: The Market’s Price Tag on a Stock
What it is: The Price-to-Earnings (P/E) ratio tells you how much investors are willing to pay for every dollar of a company’s earnings.
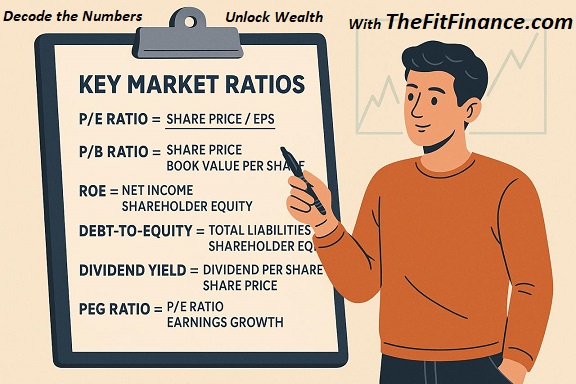
P/E Ratio = Stock Price ÷ Earnings Per Share (EPS)
What It Tells You:
• P/E between 15-25: Reasonable valuation.
• P/E above 25: Stock may be overvalued.
• P/E below 15: Could be undervalued (or facing growth challenges).
3. P/B Ratio: The Stock’s Real Worth vs. Market Hype
What it is: The Price-to-Book (P/B) ratio compares a company’s stock price to its actual book value (assets minus liabilities).
P/B Ratio = Stock Price ÷ Book Value Per Share
What It Tells You:
• P/B below 1: The stock may be undervalued.
• P/B between 1-3: A fair valuation for stable companies.
• P/B above 3: Can indicate an overvalued stock or strong growth potential.
4. ROE: The Profitability Indicator
What it is: Return on Equity (ROE) measures how effectively a company generates profit from shareholders’ investments.
ROE (%) = (Net Income ÷ Shareholder’s Equity) × 100
What It Tells You:
• ROE above industry average: A great sign—indicates efficiency.
• ROE below industry average: May signal poor management or declining business performance.
5. Debt-to-Equity Ratio: Risk Alert!
What it is: This ratio measures how much debt a company has compared to shareholder equity.
D/E Ratio = Total Liabilities ÷ Shareholder’s Equity
What It Tells You:
• D/E below 1.0: A financially stable company.
• D/E above 2.0: Risky—too much debt.
🚀 Actionable Tip: In a rising interest rate environment (like this year), avoid companies with high D/E ratios—they may struggle with loan repayments.
6. Dividend Yield: Passive Income Power
What it is: This ratio tells you how much dividend income a stock provides relative to its price.
Dividend Yield (%) = (Annual Dividend Per Share ÷ Stock Price) × 100
What It Tells You:
• High yield (above 4-5%): Good for passive income, but could indicate a weak stock.
• Low yield (below 2%): Common for high-growth stocks.
🚀 Actionable Tip: Do not chase high dividend yields blindly. A company with a 10% dividend yield might be struggling, which could lead to dividend cuts.
7. PEG Ratio: The Growth Investor’s Secret Weapon
What it is: The Price/Earnings to Growth (PEG) ratio adjusts the P/E ratio for expected earnings growth.
PEG Ratio = P/E Ratio ÷ Earnings Growth Rate
What It Tells You:
• PEG below 1: Stock is undervalued relative to growth.
• PEG above 1: Stock may be overvalued.
🚀 Actionable Tip: PEG is crucial for tech and growth stocks—always check it before investing in high-P/E stocks.
Interactive Element: Are You Holding Overvalued Stocks?
Take this quick self-check:
✅ Is your stock’s P/E above 30 but EPS growth below 10%? 🚨 It may be overvalued.
✅ Does your stock have a P/B above 3 and ROE below 10%? 🚨 It might be a weak investment.
✅ Is your stock’s D/E above 2.5? 🚨 Consider reducing exposure.
Conclusion: Invest Smarter, Not Harder
Now you have a all above ratios playbook to evaluate any stock like a pro. No more blind investing, no more following the hype—just data-backed, intelligent decisions.
Call to Action: Take Your Investing to the Next Level!
💡 What’s your favorite stock valuation ratio? Drop a comment below!
📢 Share this post with your investing buddies—knowledge grows when shared.
📩 Subscribe to TheFitFinance for weekly market insights and exclusive investing tips.


